How to Use Geo Unit Assigner
This tool needs three files: a ward boundary, a household directory, and a leaders list. Here's how to create each one.
Create the Ward Boundary (GeoJSON)
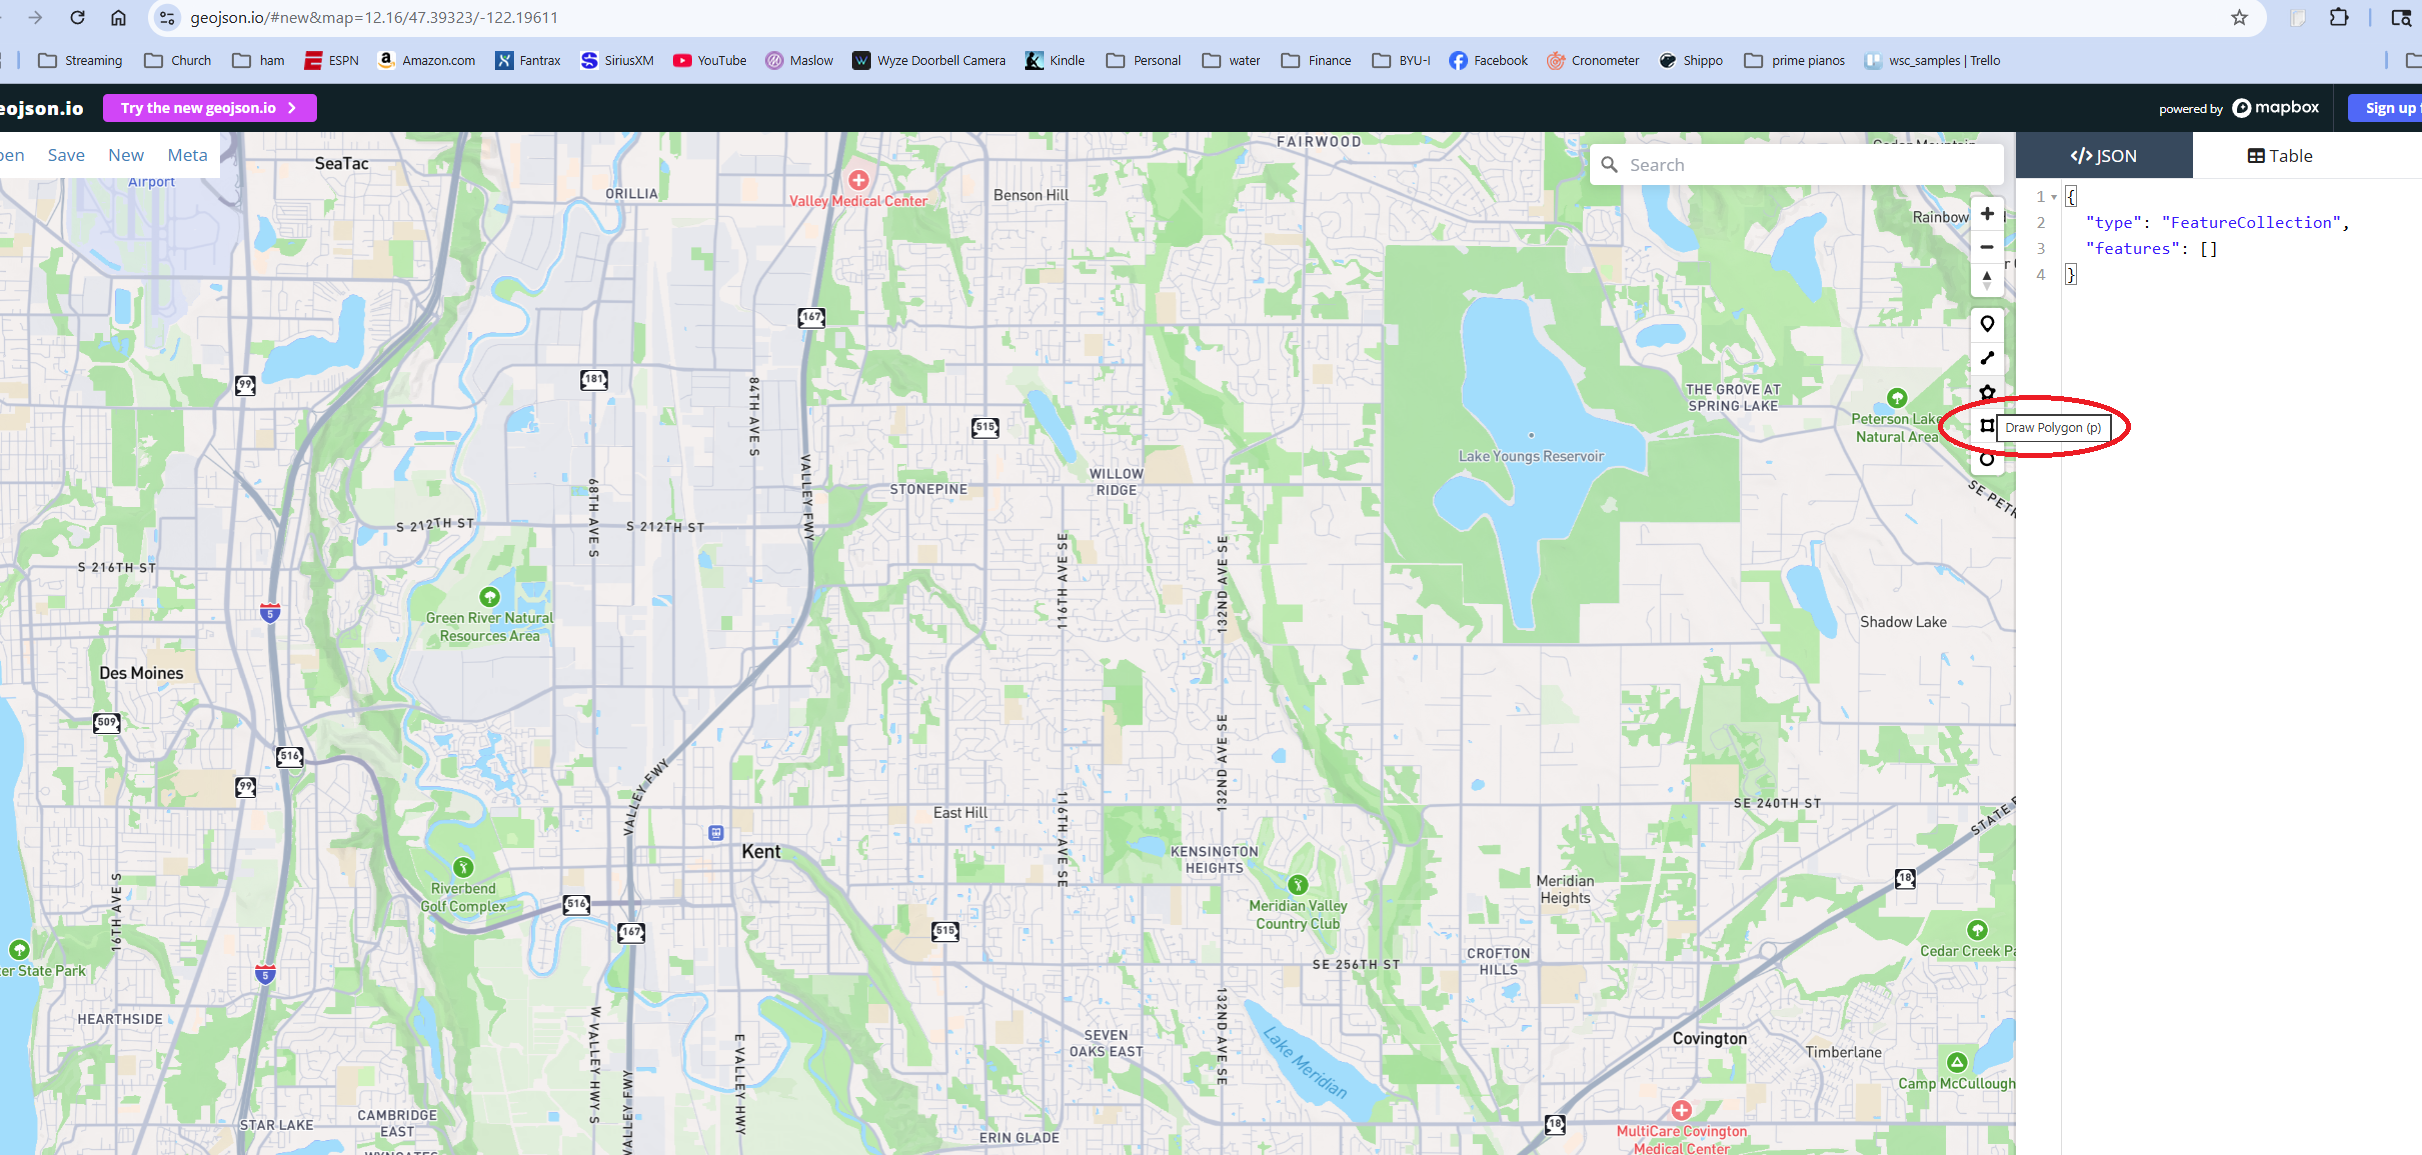
The ward boundary tells the app which households are inside the ward and defines the visible area on the map. You'll draw the boundary as a polygon using the free geojson.io tool.
- Go to geojson.io in your browser.
- Use the search box (top-right of the map) to find your ward's general area.
- Click the Draw Polygon tool in the right-side toolbar (rectangle icon).
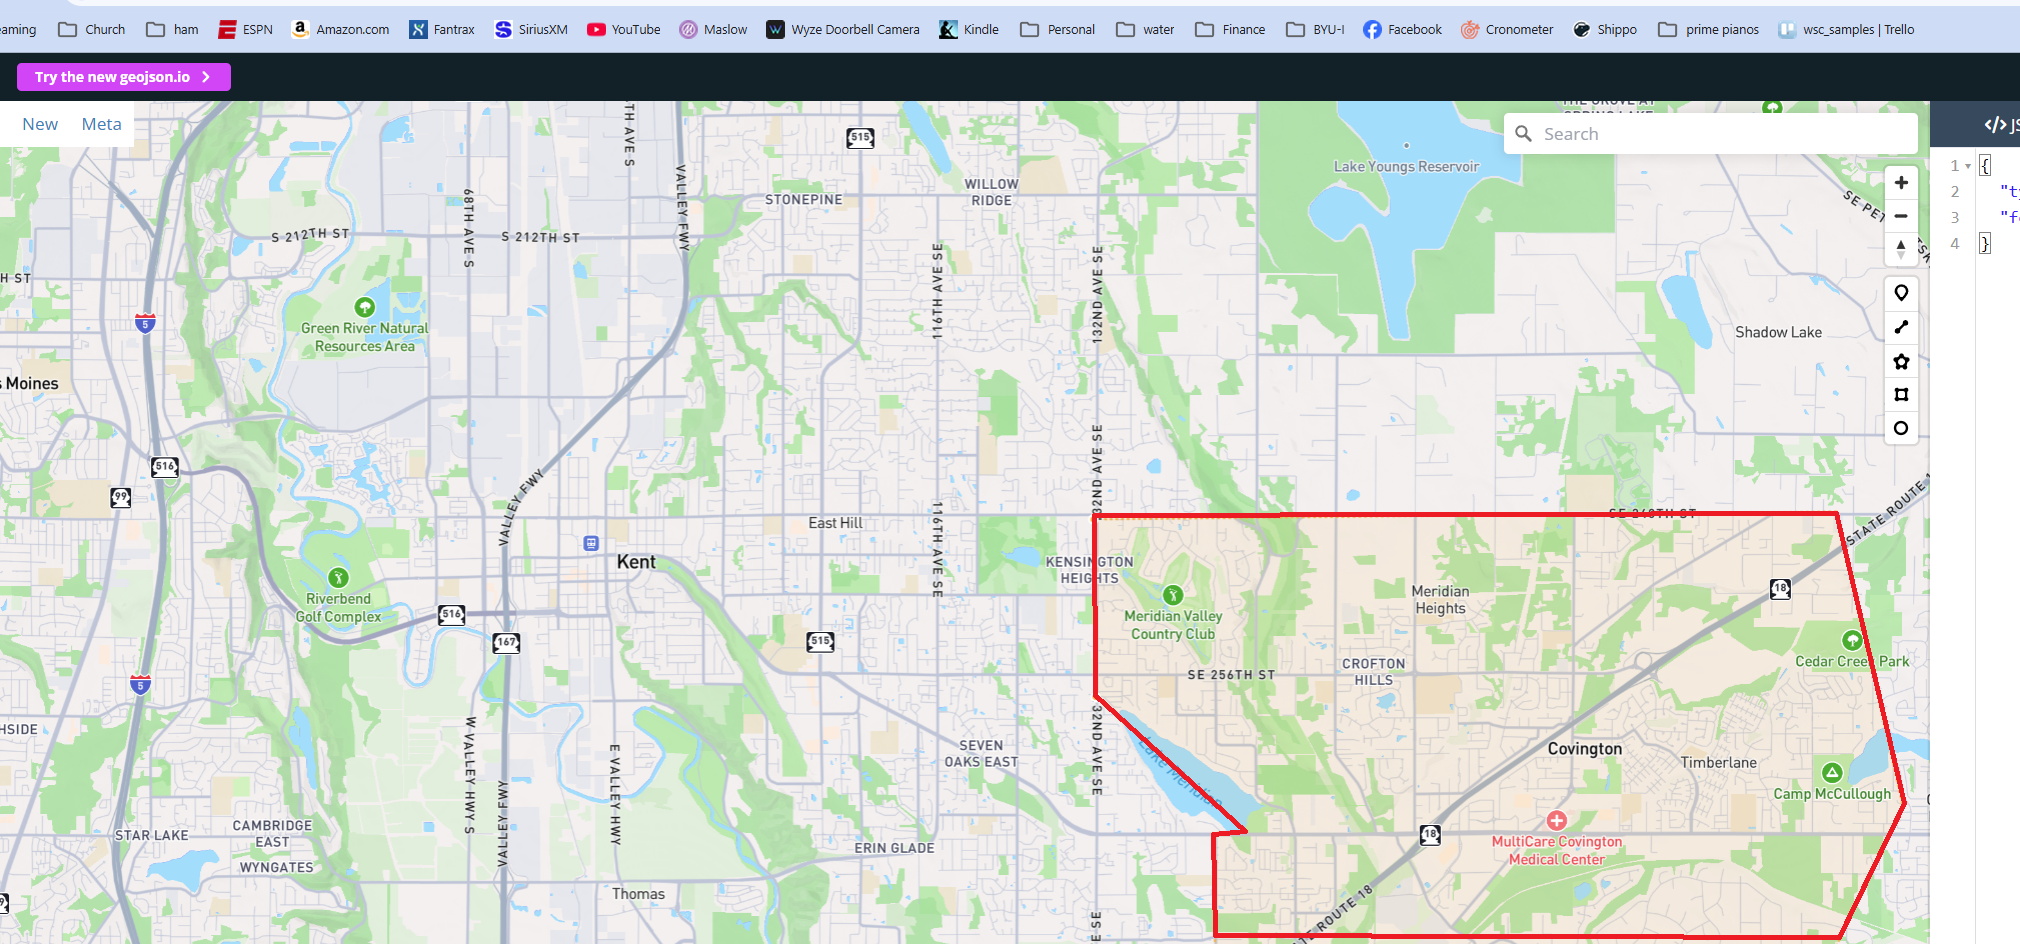
- Click around the perimeter of the ward boundary on the map, placing a point at each corner or curve.
- Double-click the final point to close and finish the polygon.
- In the top menu click Save › GeoJSON to download the file.
- Rename the downloaded file to something like
ward-boundary.geojson.
Export the Household Directory (PDF)
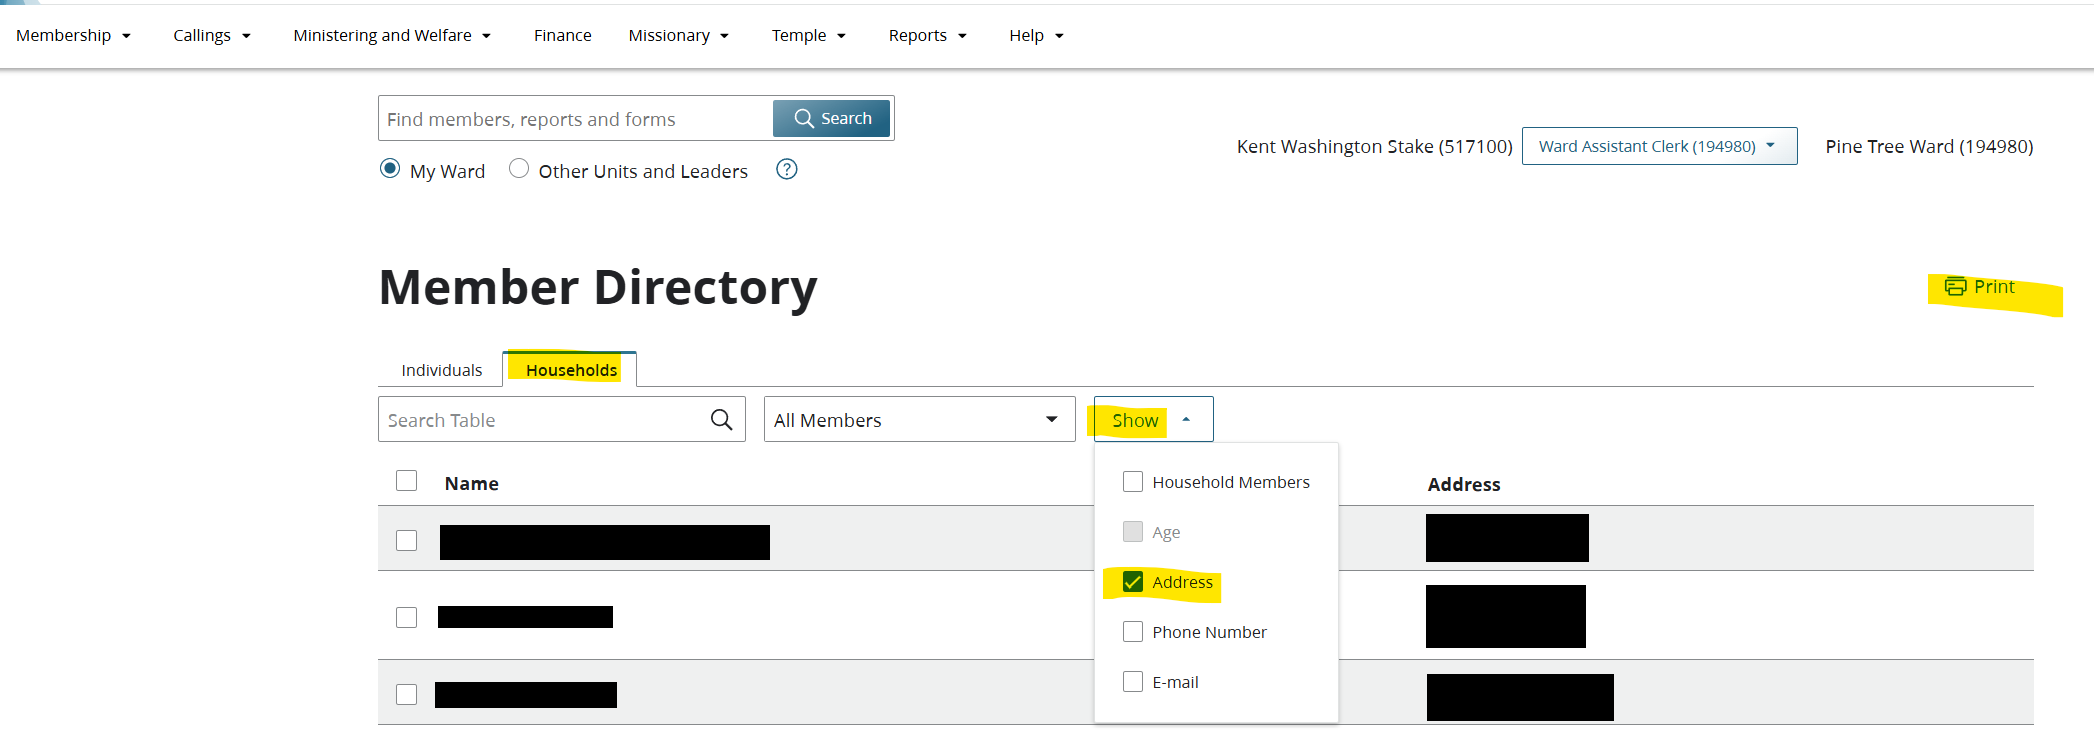
The household directory provides the list of ward members and their addresses. Export it as a PDF from LCR.
- Sign in to lcr.churchofjesuschrist.org.
- Navigate to Membership › Member Directory.
- Select the Households tab.
- Click the Show dropdown and check only Address (uncheck all others).
- Click Print and choose Save as PDF (or "Print to PDF") as the destination.
Create the Geo Unit Leaders List (CSV)
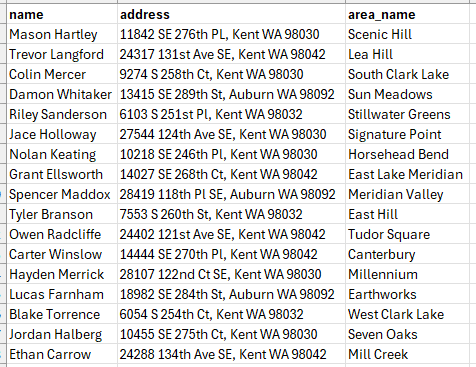
The leaders list defines who leads each geo unit and where they live. Create it as a simple CSV file with two columns.
- Open a spreadsheet application (Excel, Google Sheets, etc.) or a plain text editor.
- Create two columns with the headers
nameandaddress. - Add one row per geo unit leader — their full name and home address.
- Optionally add an
area_namecolumn to label each unit on the map and in the Excel export (e.g. "North", "East Side"). - The name column is used as the leader label; area_name appears as a section header.
- Save the file as a
.csvfile (e.g.ward-leaders.csv).
"123 Main St, Anytown WA 98000"
Note: the data shown below is randomly generated and does not represent real individuals.
Save Your Edits with the Changes File
Geocoding takes time and you may need to annotate the list over multiple sessions — marking who to include, adding HAM radio call signs, moving members to specific areas, or excluding members outside the ward. The Changes File lets you save those edits and carry them forward every time you re-run the tool from a fresh PDF, without re-entering your annotations.
First run — generating the changes file
- Run the tool with your boundary, PDF directory, and leaders list as normal.
- After the map appears, click Download Changes XLSX (the purple button).
- Open
geo_unit_changes.xlsxin Excel. Rows are color-coded by geo unit so you can see at a glance which area each member is currently assigned to. - The file has five columns:
Name,Address,Geocode,HAM, andArea. All assigned members start withGeocode=Y; theHAMandAreacolumns are blank. - Make your edits:
- Set
GeocodetoNfor any member you want excluded from future runs. - Enter a call sign (e.g.
KD7XYZ) inHAMfor radio operators — their map pin will change to a triangle. - Enter an
area_namevalue (e.g.Canterbury) inAreato force that member into a specific geo unit, overriding the proximity calculation.
- Set
- Save the file. You can keep it as
.xlsxor save as.csv— both are accepted.
Subsequent runs — applying your changes
- Export a fresh PDF from LCR as usual.
- On the upload form, fill in the three required files (boundary, PDF, leaders) as normal.
- In the Changes File field, select your saved
geo_unit_changes.xlsx. - Click Generate Assignments. The tool will:
- Apply your
Geocode,HAM, andAreavalues to matching households (matched by address). - Exclude any member whose address is marked
N. - Force-assign any member with an
Areavalue directly into that geo unit, regardless of distance or ward boundary. - Include any new members added to the ward since the last run — they won't be in the changes file, so they default to included.
- Apply your
- After the run, download a fresh changes file to capture new members and carry forward existing edits.
Area value must match the area_name in your leaders CSV exactly (case-insensitive). For example, if your leaders CSV has area_name=Canterbury, enter Canterbury (not the leader's name). Forced assignments bypass both the max-distance limit and the ward boundary check.
N.
Focus on an At-Risk Subset
If you need to prioritize outreach to a specific group — elderly members, those who haven't been contacted recently, or others who need extra attention — you can generate a focused map showing only those individuals.
- Run the tool normally for your full ward and click Download Excel to save the full assignment report.
- Open the Excel file. Find the
Geocodecolumn and change any member you want to exclude toN(or delete their row entirely). - Save the file as
.xlsxor.csv. - Return to the tool and upload this file as the Ward Directory input instead of the original PDF.
- The map and assignment report will only include members marked
Yin theGeocodecolumn.
Geocode column accepts Y, Yes, True, 1, or X as truthy values. Blank cells are treated as not included when uploading a CSV/XLSX directory directly (without a PDF).